Question 1: What graph shall I present the data ?
Well, I will use the bar graph because it will show the result easier to see that how many coins or dime, pennies, nickles, and quarters will be in the jar.
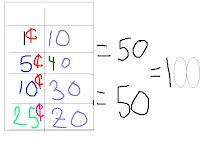
Question 2 : How many ways that we or you get to a $100
Please leave me a comment if I did bad or good >,<

this really good Elizabeth but you should explain the diagram but you did a good job though@!
ReplyDeletefor question no.1 it would be better if you made a bar graph to show the differences of each..
ReplyDeleteand for no.2 you should show or tell us how to make $100 dollars for each..
well done anyways:)
good job elizabeth, you could have used some pictures to display your data more accurately
ReplyDeletefor number 2, you could have explained how your chart works
Good job elizabeth!
ReplyDeletegreat job with the picture on how you got the $100 you did a nice job :)
good work i liked your picture and diagram but it wasn't very long maybe next time add more to it and make sure you lable everything
ReplyDelete